Figure 2
Environmental PM2.5, Physical Activity Levels, and Aerobic Capacity, of Smokers and Non-Smokers
Mayank Shukla* and Sakshi Bansal
Published: 27 July, 2023 | Volume 4 - Issue 2 | Pages: 057-062
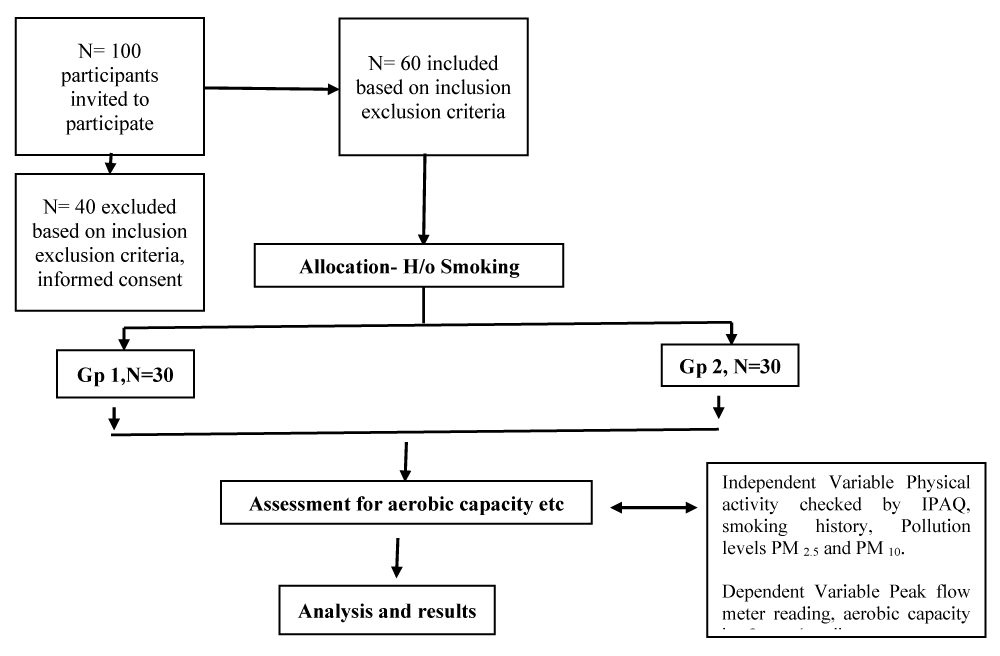
Figure 2:
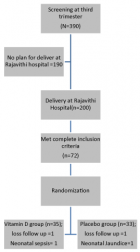
Figure 2: Study flow chart – showing population and sample as per the inclusion and exclusion criteria, allocation based on the smoking history. The variables physical activity checked by international physical activity questionnaire (IPAQ), aerobic capacity checked by Queen’s college step test, and PM 2.5 and PM 10 levels from pollution control board website data.
Read Full Article HTML DOI: 10.29328/journal.jcmhs.1001036 Cite this Article Read Full Article PDF
More Images
Similar Articles
-
Environmental PM2.5, Physical Activity Levels, and Aerobic Capacity, of Smokers and Non-SmokersMayank Shukla*, Sakshi Bansal. Environmental PM2.5, Physical Activity Levels, and Aerobic Capacity, of Smokers and Non-Smokers. . 2023 doi: 10.29328/journal.jcmhs.1001036; 4: 057-062
-
Prevalence of Risk factors of Non Communicable Diseases amongst Medical Students, Kanpur, Uttar Pradesh, IndiaLakshmi Singh*, Anju Gahlot, Atul Kumar Singh. Prevalence of Risk factors of Non Communicable Diseases amongst Medical Students, Kanpur, Uttar Pradesh, India. . 2024 doi: 10.29328/journal.jcmhs.1001048; 5: 057-061
Recently Viewed
-
Various Theories of Fast and Ultrafast Magnetization DynamicsManfred Fähnle*. Various Theories of Fast and Ultrafast Magnetization Dynamics. Int J Phys Res Appl. 2024: doi: 10.29328/journal.ijpra.1001101; 7: 154-158
-
Forest History Association of WisconsinEd Bauer*. Forest History Association of Wisconsin. J Radiol Oncol. 2024: doi: 10.29328/journal.jro.1001071; 8: 093-096
-
Synthesis of Carbon Nano Fiber from Organic Waste and Activation of its Surface AreaHimanshu Narayan*,Brijesh Gaud,Amrita Singh,Sandesh Jaybhaye. Synthesis of Carbon Nano Fiber from Organic Waste and Activation of its Surface Area. Int J Phys Res Appl. 2019: doi: 10.29328/journal.ijpra.1001017; 2: 056-059
-
Obesity Surgery in SpainAniceto Baltasar*. Obesity Surgery in Spain. New Insights Obes Gene Beyond. 2020: doi: 10.29328/journal.niogb.1001013; 4: 013-021
-
Tamsulosin and Dementia in old age: Is there any relationship?Irami Araújo-Filho*,Rebecca Renata Lapenda do Monte,Karina de Andrade Vidal Costa,Amália Cinthia Meneses Rêgo. Tamsulosin and Dementia in old age: Is there any relationship?. J Neurosci Neurol Disord. 2019: doi: 10.29328/journal.jnnd.1001025; 3: 145-147
Most Viewed
-
Evaluation of Biostimulants Based on Recovered Protein Hydrolysates from Animal By-products as Plant Growth EnhancersH Pérez-Aguilar*, M Lacruz-Asaro, F Arán-Ais. Evaluation of Biostimulants Based on Recovered Protein Hydrolysates from Animal By-products as Plant Growth Enhancers. J Plant Sci Phytopathol. 2023 doi: 10.29328/journal.jpsp.1001104; 7: 042-047
-
Sinonasal Myxoma Extending into the Orbit in a 4-Year Old: A Case PresentationJulian A Purrinos*, Ramzi Younis. Sinonasal Myxoma Extending into the Orbit in a 4-Year Old: A Case Presentation. Arch Case Rep. 2024 doi: 10.29328/journal.acr.1001099; 8: 075-077
-
Feasibility study of magnetic sensing for detecting single-neuron action potentialsDenis Tonini,Kai Wu,Renata Saha,Jian-Ping Wang*. Feasibility study of magnetic sensing for detecting single-neuron action potentials. Ann Biomed Sci Eng. 2022 doi: 10.29328/journal.abse.1001018; 6: 019-029
-
Pediatric Dysgerminoma: Unveiling a Rare Ovarian TumorFaten Limaiem*, Khalil Saffar, Ahmed Halouani. Pediatric Dysgerminoma: Unveiling a Rare Ovarian Tumor. Arch Case Rep. 2024 doi: 10.29328/journal.acr.1001087; 8: 010-013
-
Physical activity can change the physiological and psychological circumstances during COVID-19 pandemic: A narrative reviewKhashayar Maroufi*. Physical activity can change the physiological and psychological circumstances during COVID-19 pandemic: A narrative review. J Sports Med Ther. 2021 doi: 10.29328/journal.jsmt.1001051; 6: 001-007

HSPI: We're glad you're here. Please click "create a new Query" if you are a new visitor to our website and need further information from us.
If you are already a member of our network and need to keep track of any developments regarding a question you have already submitted, click "take me to my Query."


